Introduction
Words alone aren’t enough to align modern teams. Visualization—representing work and concepts visually—amplifies clarity, focus, and speed. Research shows that our brains are highly optimized for visual processing, with studies demonstrating that we can interpret and remember visual information more effectively than text alone, making visualization a strategic advantage, not just a stylistic choice.
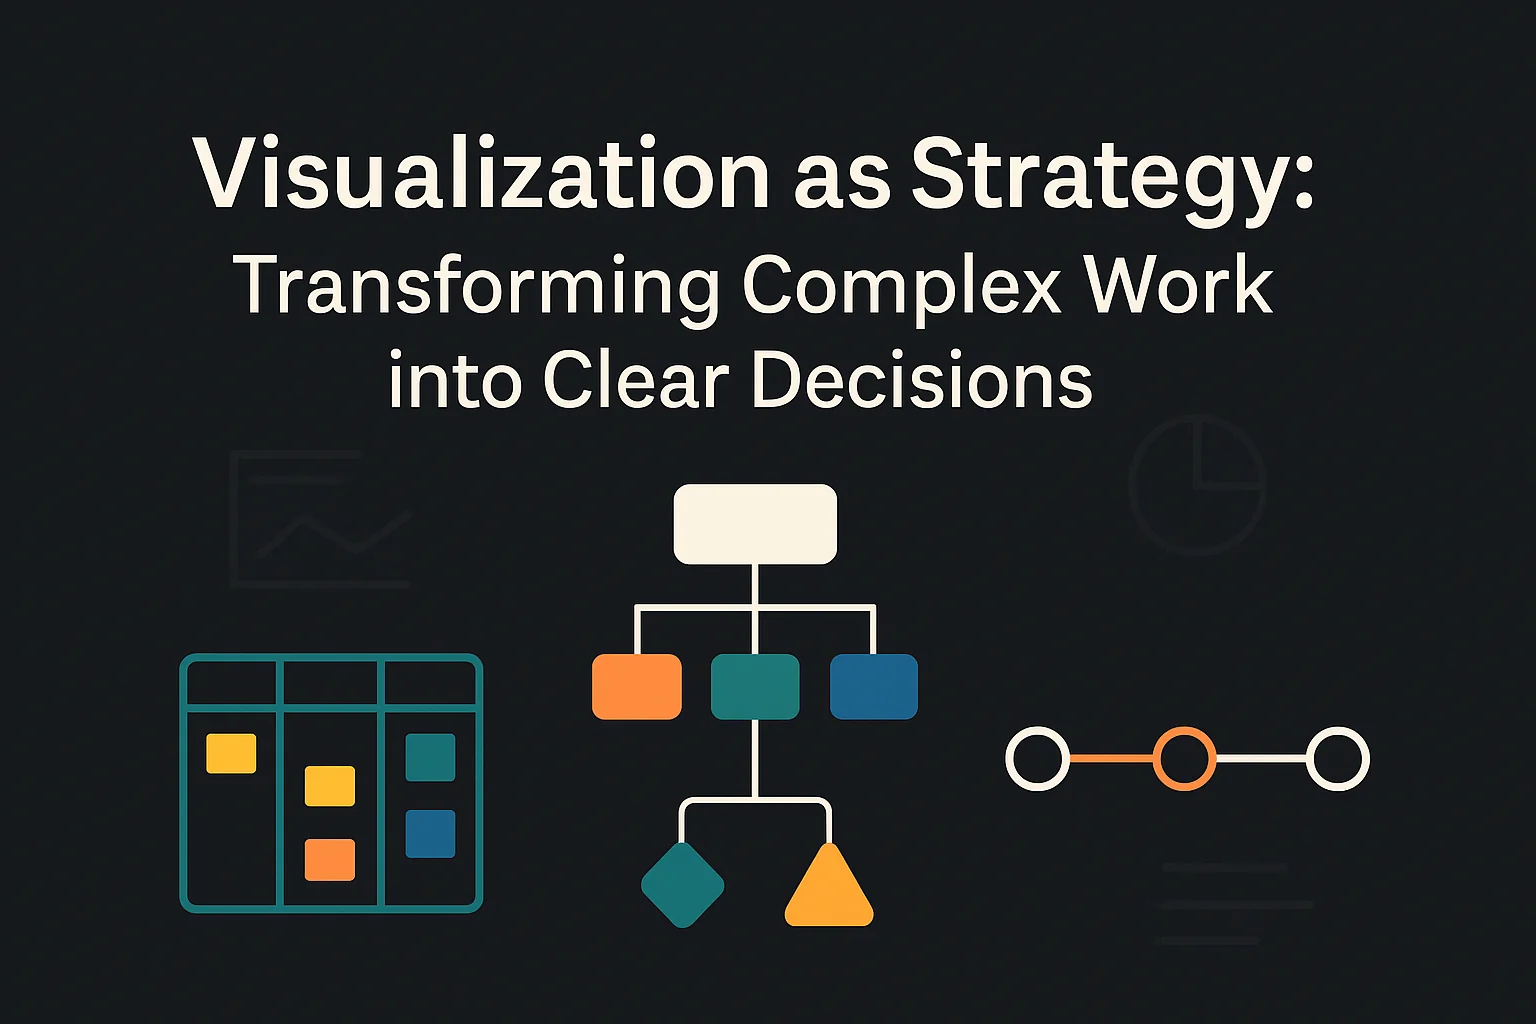
Whether it’s Kanban boards that reveal workflow bottlenecks, system diagrams that clarify dependencies, or strategic roadmaps that align teams on priorities, the right visual brings hidden complexity into the open. Organizations that master visualization achieve measurably better alignment, faster decisions, and more predictable delivery. This post outlines how to use visualization effectively—what to show, how to show it, and why it matters.
Common Mistakes
- Skipping visuals: Relying only on text or meetings to convey complex ideas.
- Misaligned to audience: Too technical for execs, too vague for implementers.
- Over-designed: Prioritizing looks over clarity and purpose.
- Inappropriate detail level: Either overwhelming with too much information or omitting critical context needed for decisions.
- Wrong tool for the job: Choosing tools based on familiarity rather than suitability.
- Inconsistency: Treating visualization as an occasional tactic rather than a consistent communication strategy.
Principles of Effective Visualization
Effective visualization follows five key principles that transform information into insight and action:
- Design for your audience: Match the level of detail and terminology to who you’re communicating with.
- Use the right form: Diagrams for structure, timelines for progress, flows for dependencies, etc.
- Keep it focused: Show what matters—no more, no less.
- Be consistent: Reuse formats, colors, and language to reduce friction.
- Iterate: Visuals evolve. Expect to revise based on feedback and new insights.
What to Visualize
- Work Management: Kanban boards, burn charts, and flow diagrams that make work visible and actionable—reducing delivery delays and improving predictability.
- Architecture & Design: Diagrams that clarify system structure, interfaces, and data flows—decreasing integration issues and technical debt.
- Strategy: Roadmaps and capability maps that link technical work to business goals—improving cross-functional alignment and investment clarity.
- User Experience: Journey maps, wireframes, and interaction flows that align teams around the customer—reducing rework and enhancing product-market fit.
- Decision Frameworks: Decision trees, risk matrices, and mental models that externalize abstract reasoning—accelerating decision cycles and improving quality of outcomes.
Tools That Help
When selecting visualization tools, consider integration capabilities, learning curve, collaboration features, and scalability for your organization’s needs:
- Whiteboarding: Digital spaces like Miro or MURAL for real-time visual collaboration.
- Diagramming: Tools like PlantUML, Mermaid or Lucidchart for system and process visualization.
- Workflow Platforms: Jira, Trello, or Azure Boards for visualizing work progress.
- Prototyping: Figma or Adobe XD for bringing interface concepts to life.
- Dashboards: Tableau, Power BI, or custom tools for transforming data into insights.
Visualization Is Not Enough
Visualization is powerful—but it doesn’t replace thoughtful communication. It’s most effective when integrated into how your team thinks, talks, and decides.
- Support it with context: A visual without explanation can be as confusing as a wall of text.
- Make it part of the conversation: Use visuals to spark discussion, not shut it down.
- Match communication styles: Combine visual, verbal, and written modes for inclusive clarity.
- Tie to outcomes: Visuals are only valuable if they influence the right decisions and behaviors.
Final Thoughts
In today’s complex, distributed work environments, visualization isn’t optional—it’s essential. Teams that make visualization a core practice consistently outperform those that don’t, achieving greater alignment, faster decisions, and more predictable delivery.
For example, enterprise technology teams that implement visualization practices across their planning and delivery processes consistently report significant improvements in release cycle times. By making dependencies visible through system diagrams and tracking flow with Kanban metrics, they identify and eliminate bottlenecks that would otherwise remain hidden in status reports and spreadsheets.
If you want to improve how your team aligns, decides, and delivers—visualize more.
Not because it looks nice. But because it works.
How does your team make complex work visible? Leave a comment below. If you’re struggling to drive better decisions through visualization, get in touch to discuss how strategic visualization can accelerate decision velocity and team alignment. Follow my RSS feed for more on decision frameworks and organizational design.